Water sampling tells our quality story
|
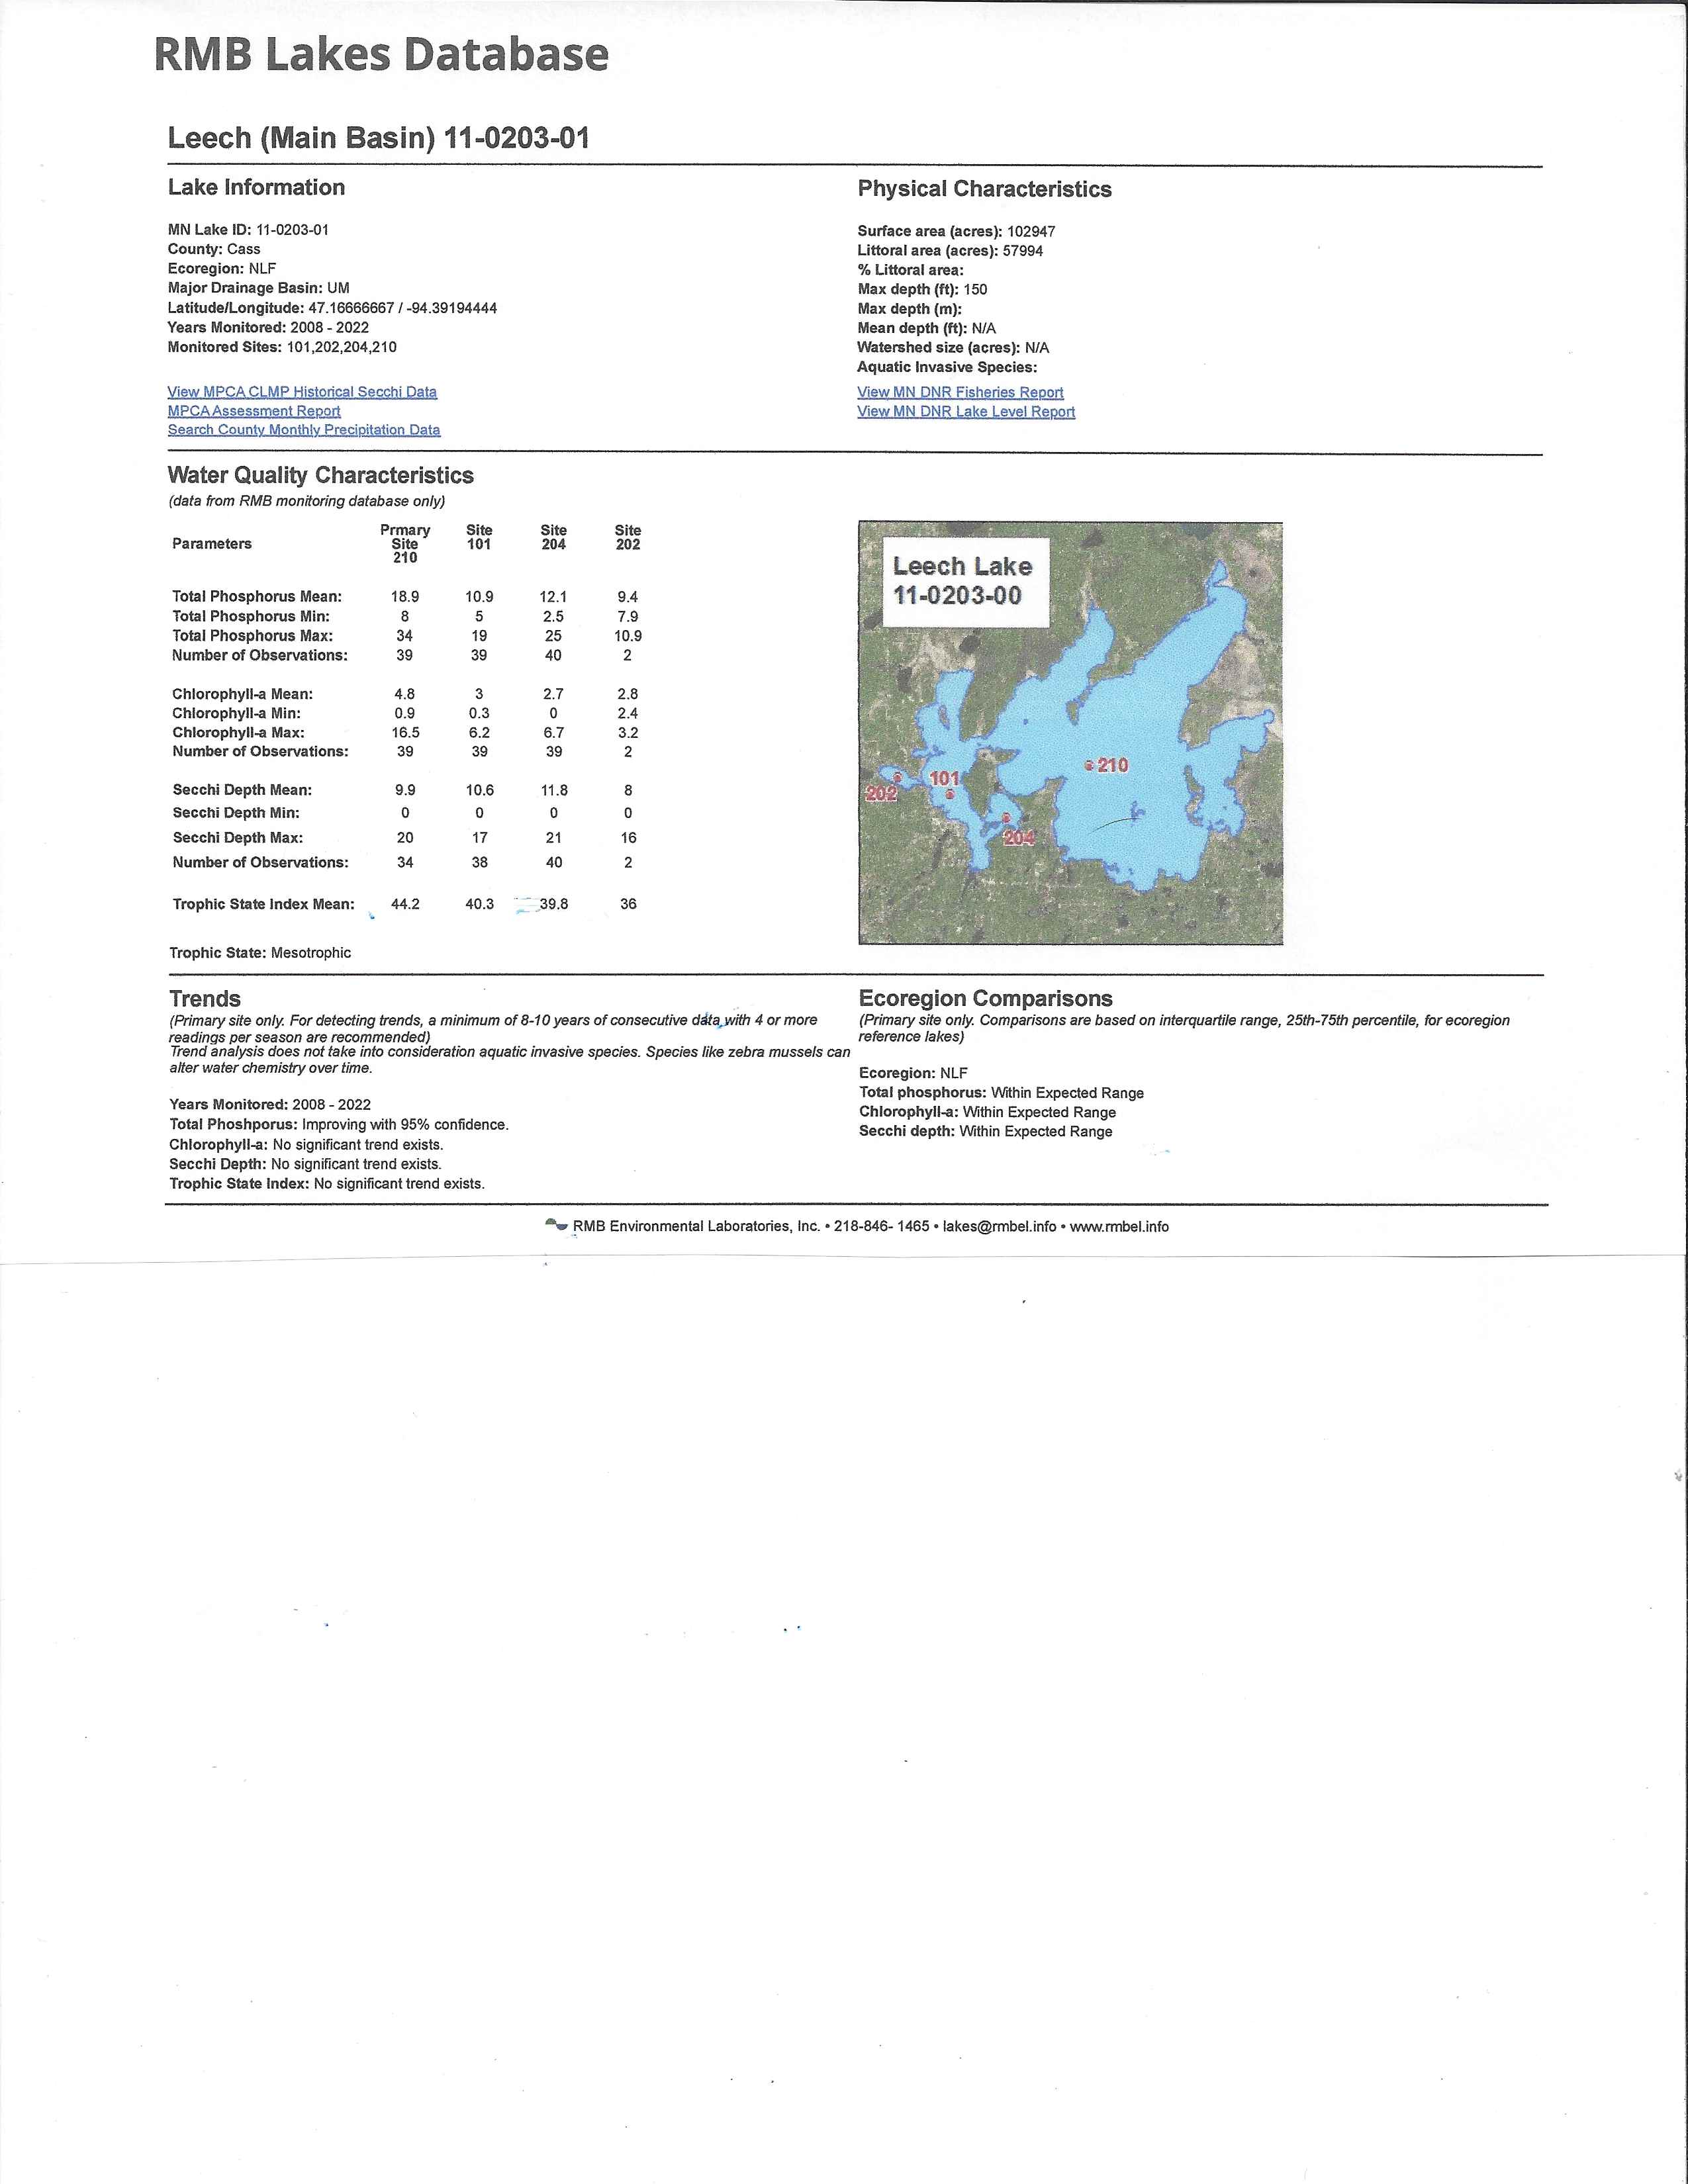
2022 RMB Lakes Database results.
Summary of Leech Lake Phytoplankton Data, 2017-2022 More information about the Trophic State Index of Leech Lake can be found in the LLA Spring 2023 newsletter. Background: Every summer since 2008 Leech Lake Association volunteers have collected water samples and taken Secchi disc readings from four places in Leech Lake: the main basin north of Stony Point, Agency Bay, Walker Bay and Kabekona Bay. These samples are analyzed to give us important information about the overall health of the lake. The tables linked below contain data about the following indicators:
Trophic States are deemed divisions of a continuum in phosphorus and algal concentration. The TSI ranges from 0-100. 0-30 is Oligotrophic, where water is very clear, phosphorus is low, and algae is sparse. This might describe a very deep, cold water lake, with oxygen throughout the year at the bottom of the lake. A TSI of 30-50 is an in-between stage where the number of aquatic plants algae increases due to more available phosphorus. Leech Lake fits within this range, though TSI may vary some between the basins. Agency Bay, for example, had an annual mean of 40.3 in 2008 and 41.4 in 2020. With the appearance of Zebra mussels in the lake, water clarity will likely increase. How this will impact the fish population is not well known. LLA will continue to collect samples and fund analysis of the phytoplankton population in Leech Lake. Continuing these studies over the next few years will provide the DNR with the information it needs to monitor the food chain and its effect on the Leech Lake fishery as the lake reacts to Zebra mussels, other invasive species, and changes to the lake chemistry due changes in phosphorus and chlorophyll-a levels. If you are interested in volunteering to help collect water samples or want to learn more about LLA efforts in this area, contact Tom McGovern at [email protected] (Water Quality chairperson). |
Watersheds: A look at the big picture
Minnesota has 80 major watersheds. Leech Lake is part of the Leech Lake River watershed, which is consists of approximately 854,659 acres (1,335 sq. miles) in the northern part of the Upper Mississippi River Basin. The watershed includes parts of Beltrami, Cass and Hubbard Counties, as well as the Leech Lake Reservation (Leech Lake Band of Chippewa). The Leech Lake River Watershed has 277 total river miles and contains over 750 lakes with a total acreage of 166,374. Extensive work has been done to document and monitor the health of the water in our watershed. LLA actively participates in water quality monitoring through the Citizen Lake Monitoring Program. According to the Minnesota Pollution Control Agency, the surface water resources within this watershed meet Minnesota water quality standards for conventional pollutants (not including mercury). These resources are prized, and their protection is vital in sustaining the local economy and natural heritage and character of this watershed. The major threats to the watershed include:
Vertical Divider
|